Dashboard Overview
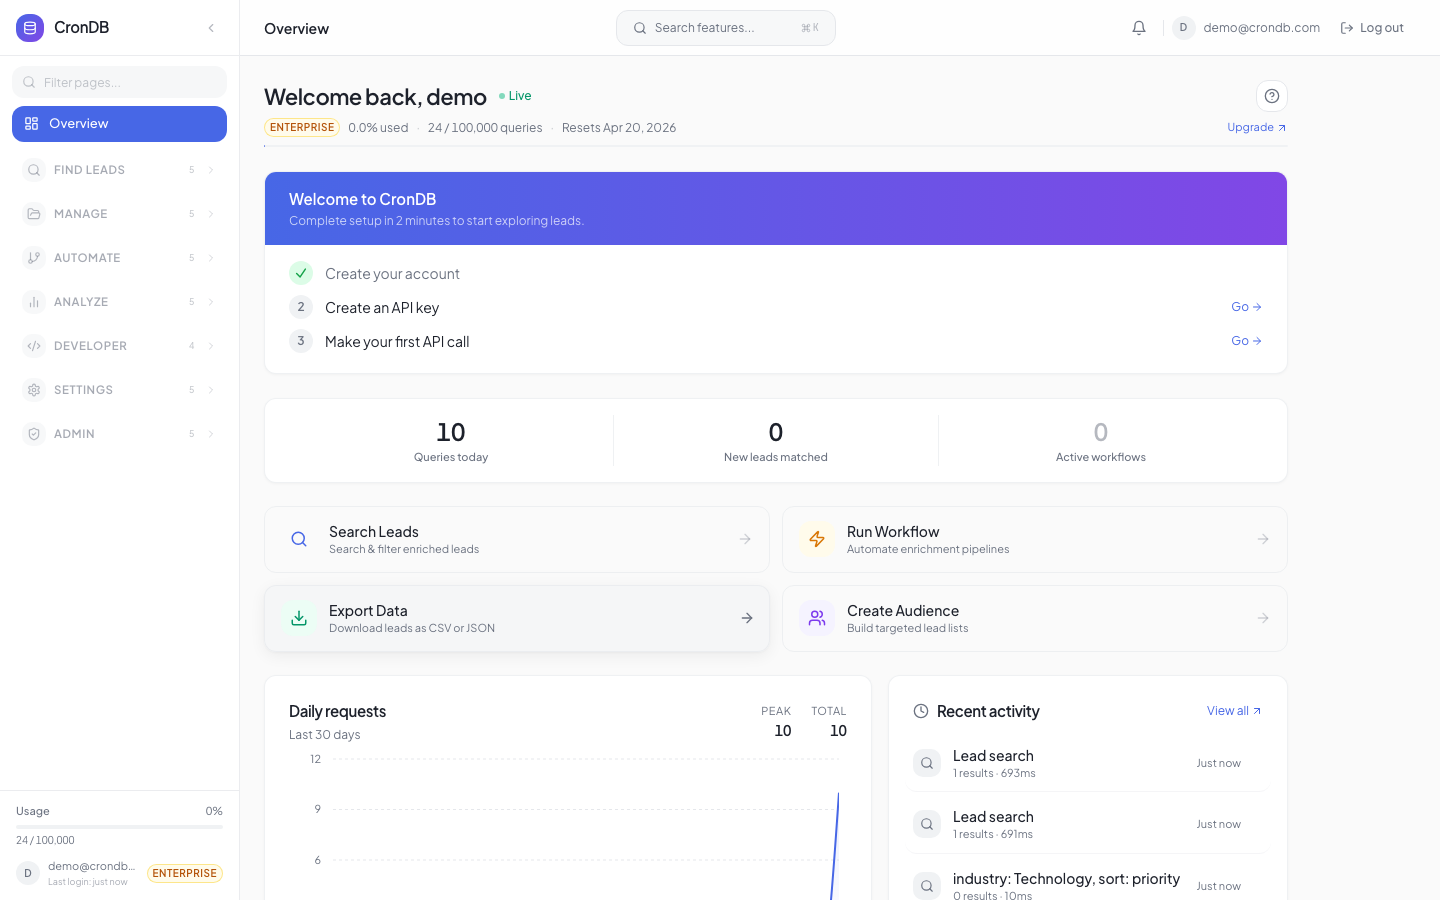
The CronDB dashboard is your command center for discovering, enriching, and managing domain leads. This page covers the main features and how to navigate between them.
Getting to the Dashboard
After signing in at app.crondb.com, you land on the Overview page. This shows your current plan, quota usage, and recent activity at a glance.
Welcome Header
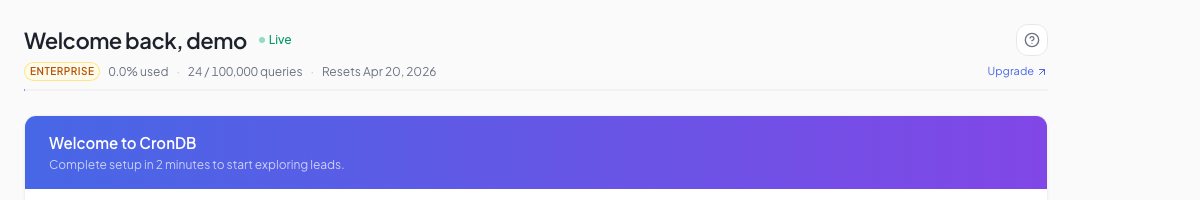
Main Sections
Discovery Tools
| Tool | Purpose | Location |
|---|---|---|
| Domain Explorer | Search and filter domains by industry, country, tech stack | Sidebar → Discovery |
| Email Finder | Look up contact emails for any domain | Sidebar → Discovery |
| Tech Stack Lookup | See what technologies a domain runs | Sidebar → Discovery |
| Enrichment | Waterfall enrichment from multiple data providers | Sidebar → Discovery |
Lead Management
Organize your prospects into lists, apply scoring rules, and track changes:
- Lead Lists — Group domains into named lists for segmentation and outreach
- Audiences — Dynamic, filter-based groups that auto-update as new domains match
- Scoring Rules — Create weighted scoring models to prioritize leads
- Watchlist — Monitor specific domains and get notified of changes
- Domain 360 — Full enrichment view for a single domain
- Export Center — Download data as CSV or JSON
Outreach
Build and manage multi-step outreach campaigns:
- Sequences — Multi-channel campaigns (email, LinkedIn, phone)
- Templates — Pre-built and custom email templates
- AI Writer — Generate personalized outreach copy
Alerts & Notifications
Stay informed about new leads and changes:
- Intent Alerts — Trigger notifications when domains match your criteria
- Webhooks — Push events to your backend systems
- Email Notifications — Digest and real-time email alerts
Search & Navigation
Command Palette
Press Cmd+K (Mac) or Ctrl+K (Windows/Linux) to open the command palette. From here you can:
- Jump to any dashboard page by name
- Search for a specific domain
- Open a recent lead list
- Create a new alert or list
Sidebar
The sidebar groups features into collapsible sections. Click any item to navigate directly. The sidebar can be collapsed with the toggle button at the top or by pressing Cmd+/.
Settings
Access account-level settings from the bottom of the sidebar:
- Settings — Profile, timezone, password
- Team — Manage members and roles
- Billing — View plan, invoices, upgrade
- API Keys — Create and manage API credentials
Dashboard Widgets
The Overview page includes several widgets:
- Usage Meter — Visual bar showing API queries consumed vs. remaining
- Daily Request Chart — Line chart of API usage over the last 30 days
- Recent Activity — Latest searches, list additions, and alert triggers
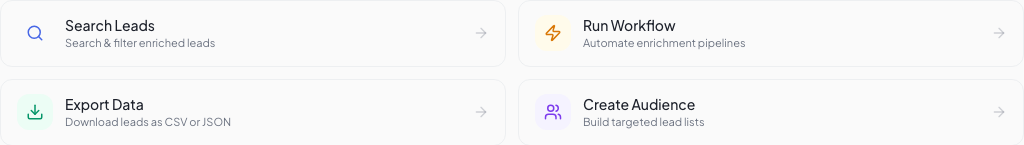
- Quick Actions — Buttons for common tasks (new search, create list, add alert)
Quick Actions
Jump straight to common tasks:
Keyboard Shortcuts
| Shortcut | Action |
|---|---|
Cmd+K / Ctrl+K | Open command palette |
Cmd+/ / Ctrl+/ | Toggle sidebar |
Escape | Close modal or panel |
Next Steps
- Lead Lists — Start organizing your leads
- Scoring Rules — Prioritize your pipeline
- Quick Start — If you have not set up your account yet