Dashboard Tour
This guide walks you through every section of the CronDB dashboard.
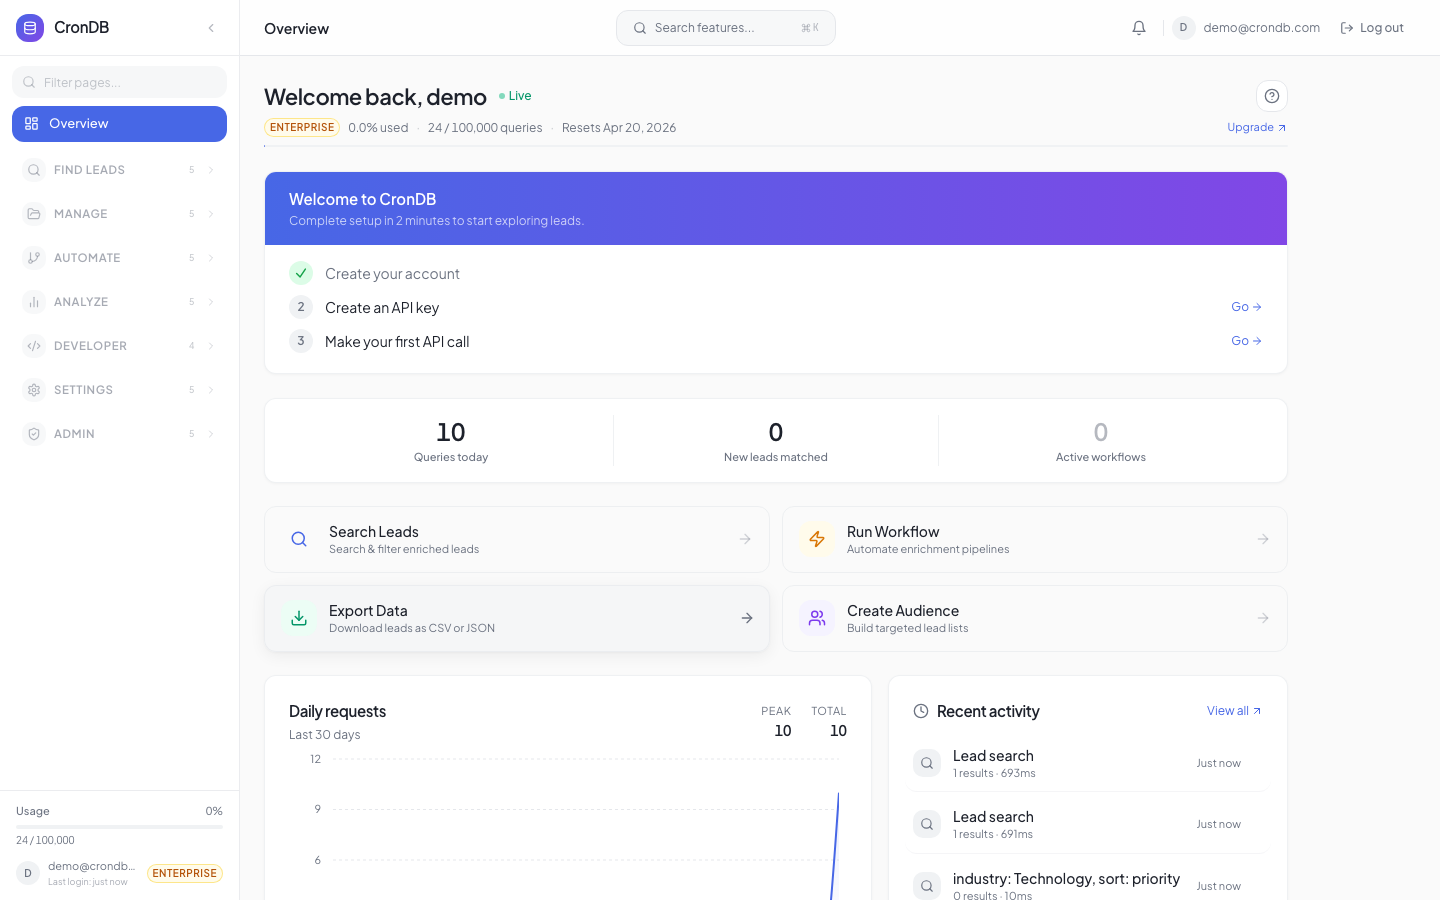
Overview Page
The first thing you see after logging in. Shows:
- Plan status — Current plan and quota usage
- Monthly quota bar — Visual progress of API usage
- Quick stats — Queries used, remaining, reset date
- Daily request chart — Usage trends over the last 30 days
Sidebar Navigation
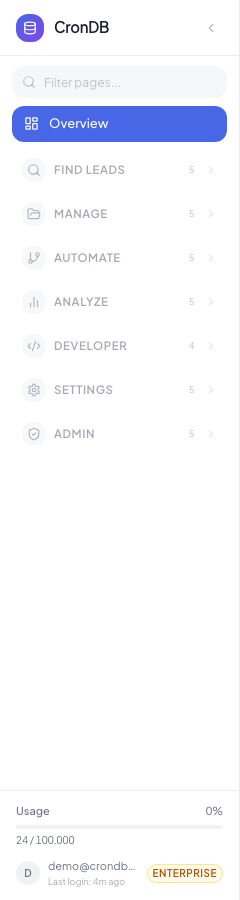
The sidebar is organized into sections:
Discovery
- Domain Explorer — Search and filter the entire domain database
- Email Finder — Find contact emails for any domain
- Tech Stack Lookup — See what technologies a domain uses
- Enrichment — Waterfall enrichment across multiple data sources
Lead Management
- Lead Lists — Organize domains into lists for tracking and outreach
- Scoring Rules — Create custom scoring models to rank leads
- Watchlist — Monitor specific domains for changes
- Domain 360 — Deep-dive view of a single domain
- Workflows — Automate actions based on triggers
- Sequences — Multi-step outreach campaigns
- Export Center — Download data as CSV/JSON
Alerts & Notifications
- Intent Alerts — Rules that notify you when matching domains appear
- Webhooks — Send events to your applications
- Email Notifications — Configure email-based alerts
Developer
- API Keys — Manage your API credentials
- API Playground — Test API calls in the browser
- Usage — Detailed API usage analytics
Account
- Settings — Profile, password, preferences
- Team — Invite and manage team members
- Billing — Plan management and invoices
- Referrals — Earn free queries by referring users
Domain Explorer
The Domain Explorer is the primary search interface. You can filter domains by:
| Filter | Description | Example |
|---|---|---|
| Industry | AI-classified industry | "Technology", "Healthcare" |
| Country | Registrant country | "US", "GB", "DE" |
| Tech Stack | Detected technologies | "WordPress", "Shopify" |
| Date Range | Registration date | Last 7 days, last 30 days |
| Has Email | Domains with contact email | Yes / No |
| Business Type | B2B, B2C, etc. | "B2B SaaS" |
Results appear as a scrollable table with columns for domain, industry, country, date, and a confidence score. Click any row to open the Domain 360 view.
Saving Searches
Click Save Search to store your filter combination. Saved searches appear in the sidebar under Domain Explorer for quick access.
Top Bar
The top bar provides quick search (Cmd+K), notifications, and account access:

Command Palette
Press Cmd+K (or Ctrl+K on Windows/Linux) anywhere to open the Command Palette — a quick search that lets you:
- Jump to any page in the dashboard
- Search domains by name
- Open recent lead lists
- Trigger common actions (create list, add alert)
The command palette is the fastest way to navigate the dashboard without using the sidebar.
API Playground
Navigate to Developer → API Playground to test API calls directly in the browser:
- Select an endpoint from the dropdown
- Fill in parameters using the form fields
- Click Send Request
- View the JSON response in the output panel
The playground automatically uses your API key, so you do not need to manually configure authentication headers.
Cmd+K/Ctrl+K— Command paletteCmd+//Ctrl+/— Toggle sidebarEscape— Close any open modal or panel
Help & Support
Click the ? icon in the top-right of any page to see contextual help — tips, steps, and guides specific to that feature. You can also reach support at support@crondb.com or through the in-app chat widget.
Next Steps
- Lead Lists — Organize your prospects
- Scoring Rules — Rank leads automatically
- Outreach Sequences — Automate campaigns