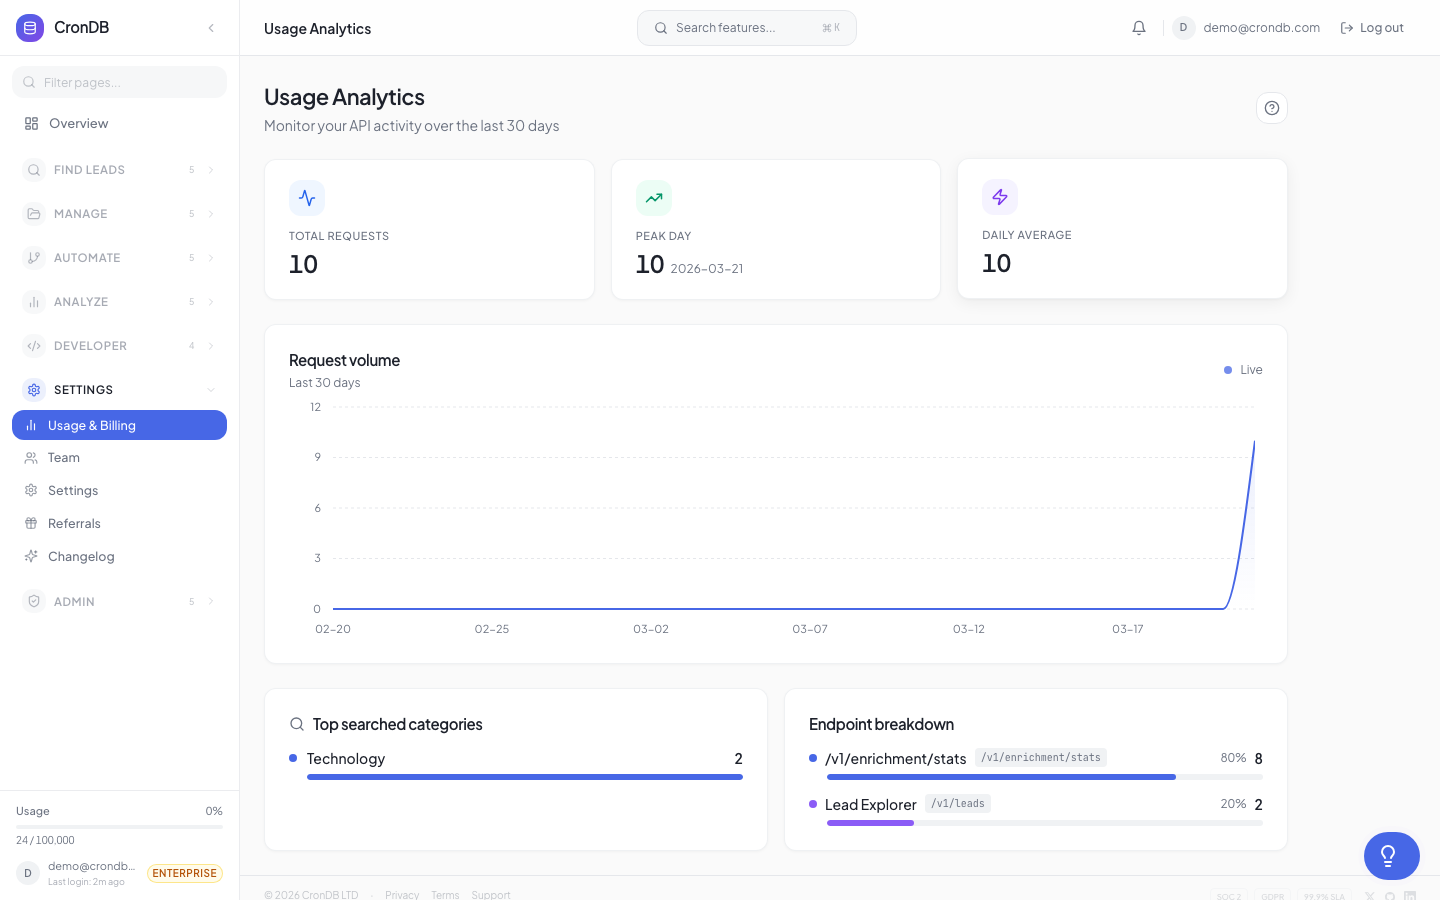
Usage Dashboard
The usage dashboard shows detailed analytics about your API consumption, quota status, and usage trends.
Accessing Usage Data
Navigate to Developer → Usage in the sidebar. You can also see a quick summary on the main dashboard Overview page.
Quota Overview
The top of the page shows:
| Metric | Description |
|---|---|
| Queries Used | Total API queries consumed this billing period |
| Queries Remaining | How many queries you have left |
| Reset Date | When your quota resets (billing cycle date) |
| Usage Percentage | Visual progress bar |
Usage Chart
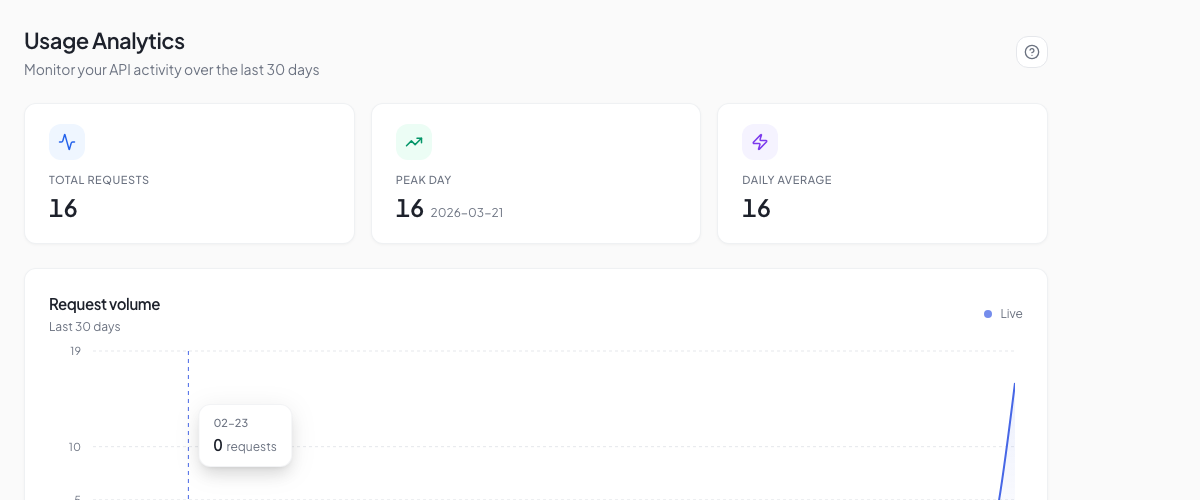
Daily Breakdown
A line chart shows your daily API usage for the current billing period:
- X-axis — Days of the billing period
- Y-axis — Number of API queries
- Trend line — Average daily usage
- Projected — Dotted line showing projected usage based on current trend
Hover over any day to see the exact count.
Usage by Endpoint
A breakdown table shows which endpoints consume the most queries:
| Endpoint | Queries | % of Total |
|---|---|---|
/v1/enrichment/domain | 4,521 | 45.2% |
/v1/search/domains | 2,890 | 28.9% |
/v1/enrichment/bulk | 1,200 | 12.0% |
/v1/email-finder | 890 | 8.9% |
/v1/tech-stack | 499 | 5.0% |
This helps you understand where your quota is going and optimize if needed.
Usage by API Key
If you have multiple API keys, see which key is consuming the most:
| API Key | Name | Queries |
|---|---|---|
| cdb_...a1b2 | Production | 7,200 |
| cdb_...c3d4 | Staging | 1,800 |
| cdb_...e5f6 | Zapier | 1,000 |
Quota Alerts
CronDB sends automatic notifications at these thresholds:
| Threshold | Notification |
|---|---|
| 80% | Email warning: "You've used 80% of your monthly quota" |
| 95% | Email warning: "You're about to reach your limit" |
| 100% | Email alert: "Quota exhausted" (Free) or "Overage billing active" (Paid) |
Configure these alerts in Account → Settings → Notifications.
Quota Limits
When you reach your monthly or daily quota:
- The API returns
429 Too Many Requestserrors - A warning banner appears in the dashboard at 80% usage
- Your quota resets at the start of each billing cycle
Each plan also has a daily rate cap (20% of the monthly quota) to prevent burst usage:
| Plan | Monthly Quota | Daily Cap |
|---|---|---|
| Free Trial | 200 lifetime | 50/day |
| Starter | 2,000/mo | 400/day |
| Pro | 10,000/mo | 2,000/day |
| Business | 50,000/mo | 10,000/day |
| Enterprise | 200,000/mo | 40,000/day |
Exporting Usage Data
Click Export on the usage page to download your usage data as CSV:
date,endpoint,queries,api_key_name
2026-03-01,/v1/enrichment/domain,142,Production
2026-03-01,/v1/search/domains,89,Production
2026-03-02,/v1/enrichment/domain,167,Production
This is useful for internal reporting and cost allocation.
Historical Usage
Toggle between billing periods using the date selector at the top of the page. CronDB retains 12 months of usage history.
Next Steps
- Plans & Pricing — Compare plans and their quotas
- Upgrade Guide — Upgrade for higher quotas
- API Rate Limits — Understand rate limits vs. quotas